This week in class we were reporting analytics data for different websites. The website I had was for National Tiger Sanctuary. I set the date range to be from 10/03-10/09/16 and from there I examined the analytics data. I started off by going to acquisition and then looking at the overview report for the National Tiger Sanctuary site. The below graph displays how many people visit the site and where they came from. As shown, 97% of the visitors came to the site because of a referral. Referral Traffic means that a user clicked on a link from another website that linked back to the National Tiger Sanctuary website. This data is good to know because it shows how people are hearing about the website and actually going to it.

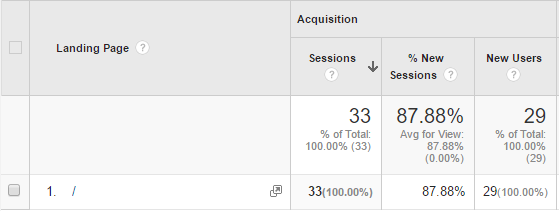
Another important display to look at is the landing page to know how visitors are entering your site because it is a key component to be successful. Presented below shows the data from the landing page, of those who visited the site during this date range, 29 of the users were new. The only landing page that was presented was the home page, therefore, those users were taken to the home page of the National Tiger Sanctuary site, which was interesting to see.

No comments:
Post a Comment